Ingest Data From MySQL to Elasticsearch
Prologue
Following Setup Elasticsearch with Kibana, we are going to transfer our data from MySQL to Elasticsearch. As for the mediator, we use Logstash. So, here we go?
For the official document, see Ingest data from a relational database into Elasticsearch Service.
Here are some useful links that might be of help.
1. Installation
1.1 JDBC
JDBC is what connect MySQL and Logstash. So first, go to official download page Connector/J to download a suitable version for you. You may have it downloaded on Windows, then transfer it to your Linux server. Or you can copy the download link and use wget.
It seems that the latest 8.2.0 version does not support Ubuntu 20.24 anymore, so you can find older version in archives.
Then, use dpkg to install it.
1 | sudo dpkg -i mysql-connector-j_8.0.33-1ubuntu20.04_all.deb |
Now, you should find mysql-connector-java-8.0.33.jar in /usr/share/java/.
1.2 Logstash
Still, the same as installation of Elasticsearch. If you’ve already done this, skip it.
1 | wget -qO - https://artifacts.elastic.co/GPG-KEY-elasticsearch | sudo gpg --dearmor -o /usr/share/keyrings/elasticsearch-keyring.gpg |
Install Logstash.
1 | sudo apt install logstash |
That’s it. Then, we are going to configure them so that our data can be synced.
2. Preparing MySQL Database
To populate data from MySQL to Elasticsearch with Logstash, there is one requirement for our table. That is, a timestamp field, which is the TrackingTime here.
1 | CREATE TABLE `Works` ( |
This field should always be the latest time, so that Logstash can track the changes made to MySQL.
3. Setup Logstash Pipeline
To digest data from MySQL to Elasticsearch, you have to manually configure how Logstash handle each table.
3.1 Logstash Configuration
Here is an example logstash.conf, you can place it anywhere you like.
Logstash Configuration Template
1 | input { |
Modify it depends on your circumstances. And here I’ll explain some properties.
jdbc_driver_library
It is just the absolute path of MySQL connector you’ve downloaded just now. It should look like this.
jdbc_connection_string
Then in the
jdbc_connection_string, just specify the MySQL host and your database name. Table name is set later in SQL statement.
tracking_column, statement
tracking_columnis thetimestampcolumn you added in MySQL. Here, we made a little wrap to make it nameunix_ts_in_secs, but instatement, you should still useTrackingTime.
schedule
It defines the time and frequency Logstash contact MySQL. In this case, Logstash will contact MySQL every 5 seconds. It uses rufus syntax. Refer to its repository for more information.
filter
This tells Logstash to make some modification to your data before adding it to Elasticsearch. You can copy the MySQL id to Elasticsearch, and remove some unnecessary fields. If you still want to keep
id, remove it fromremove_field.
output
In output, we should define how we output to Elasticsearch. If you do have SSL, set it to
true. (SSL property seems to be deprecated.) Here you need your Elasticsearch credentials. The most important thing is specify the index you want to add it to.
3.2 Logstash Pipeline
See details on this problem here: How to setup multiple config file in logstash. And the official solution for this is here: Multiple Pipelines.
By default, Logstash configuration files and pipeline file are located /etc/logstash/conf.d/ and /etc/logstash/pipelines.yml. You should put all your configuration files in conf.d and add them to pipelines.yml.
If you specify any configuration file when you start up Logstash, it will ignore the default pipelines.yml, thus use no configuration files in conf.d.
The pipeline file contains settings for multiple configurations. It is OK in most case, refer to the official documentation for more information.
1 | - pipeline.id: main |
If you do not want to differ each pipeline, just use the wildcard by default to use all configuration files.
4. Get the Data Flow!
4.1 Run Logstash
After all these steps, we can finally get our data from MySQL. Unlike Elasticsearch or Kibana, Logstash itself is not registered as a service, so you have to keep the session alive, or use tmux.
If you configured pipeline, which is recommended, go to /usr/share/logstash/bin, and simply run ./logstash. Then you’ll see it running, and output the data ingested.
However, it may not working as expected as it tell you that:
1 | WARNING: Could not find logstash.yml which is typically located in $LS_HOME/config or /etc/logstash. You can specify the path using --path.settings. Continuing using the defaults |
So, in this case, you should explicitly tell Logstash where to find logstash.yml, which, actually does reside in /etc/logstash/. I’ve no idea why it cannot find that. Or you might need root privilege.
1 | ./logstash --path.settings /etc/logstash/ |
Now, everything should work well.
4.2 Perform Queries in Kibana
If you haven’t deployed Kibana yet, please follow the instructions in Setup Elasticsearch with Kibana first.
In Logstash Configuration, we specified which index we want Logstash to put into Elasticsearch. So here, we are going to use this index in our query.
Go to “Management | Dev Tools”, and you’ll see a Elasticsearch query console.
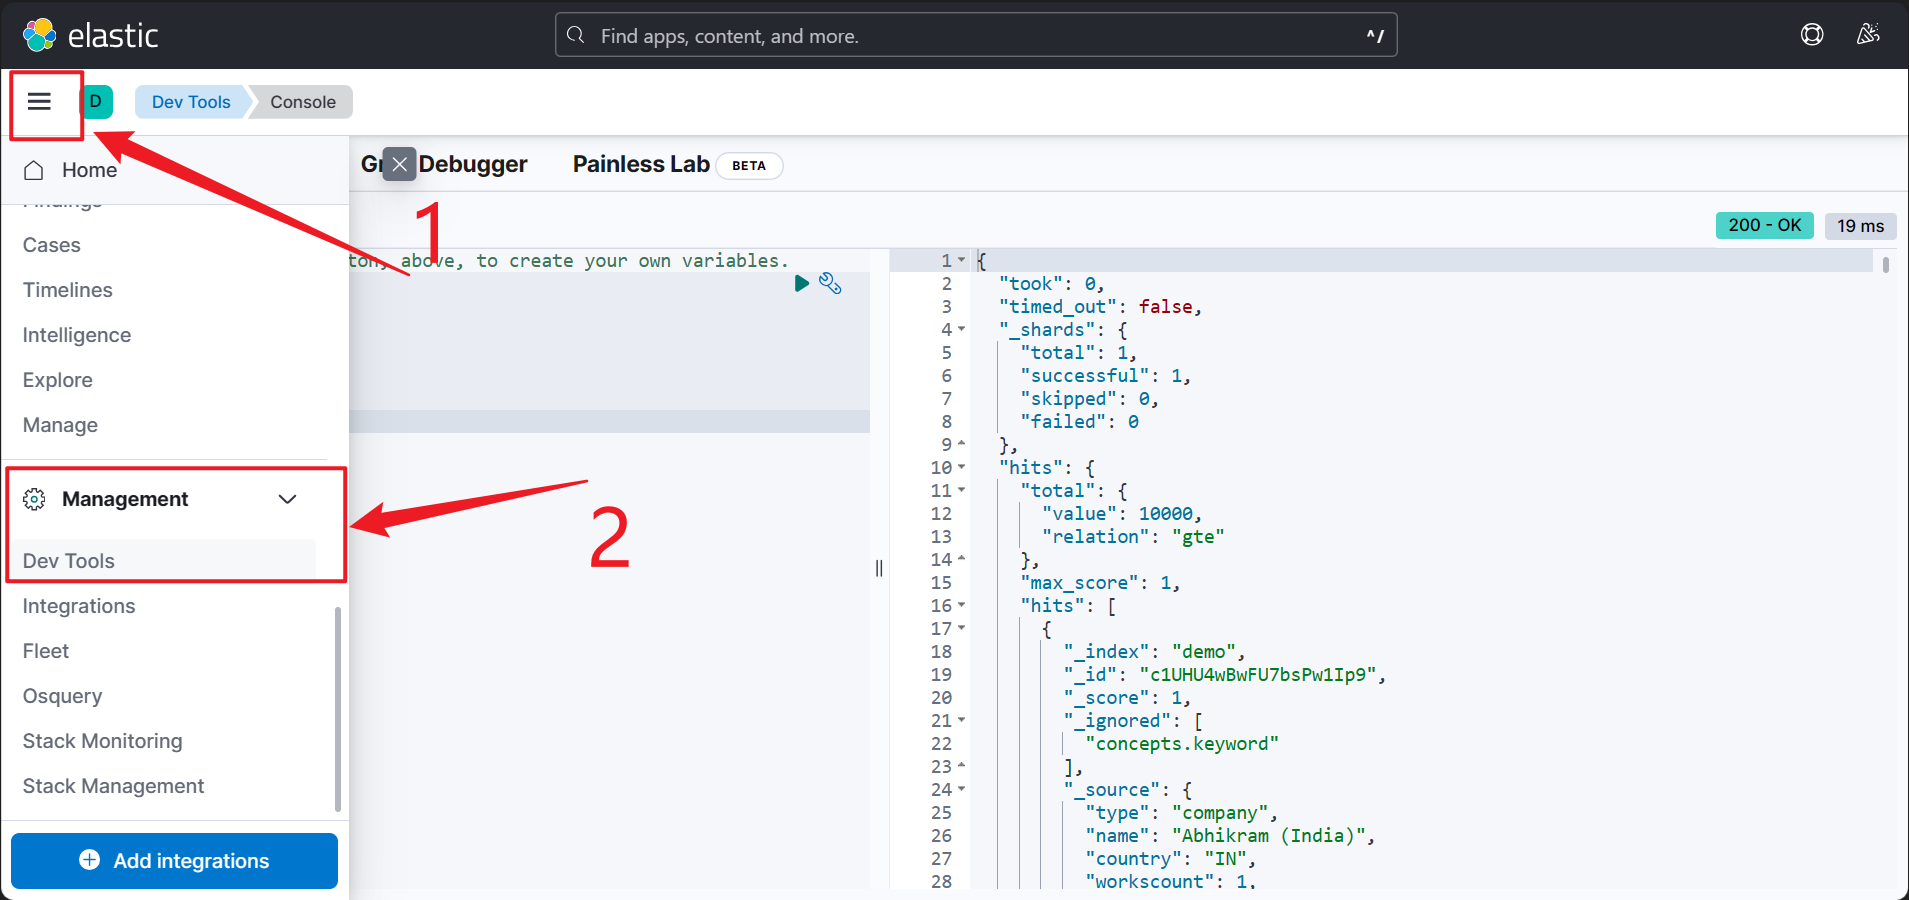
In my case, the index name is demo, so I can write the query this way to get at most 20 records. And it works.
1 | GET demo/_search |
The syntax of the syntax of Elasticsearch is not intended to be included in this post, you can refer to other great articles for that. Or you can simply use their language bindings. 😉
Epilogue
So, this is it, we did it! 🥳 Now we can sync our data from MySQL to Elasticsearch. Hopefully, there will be other posts about how to use Elasticsearch in ASP.NET Core. Coming soon. 🤤
 WeChat


