Setup Elasticsearch With Kibana
Prologue
Recently, I got to index huge amount of data, and Elasticsearch seems to be the best choice for me. It involves many problems, such as how to populate data from relational database, such as MySQL to Elasticsearch. So as the first one in this series, I’ll show you how to set up Elasticsearch, and monitor it with Kibana on a Ubuntu server.
Here is a great video, and I learnt much from him: Install Elasticsearch + Kibana 8.x with TLS/SSL. Much thanks! 😊
1. Setup Elasticsearch
You can find the official document for the current version of Elasticsearch here: Elasticsearch Guide.
Here we use the latest version, which by the time I’m writing, is 8.11.
1.1 Installation
And I think it is easier to install it via package management Install Elasticsearch with Debian Package.
Just copy these to a bash file and run it. 😉
1 | wget -qO - https://artifacts.elastic.co/GPG-KEY-elasticsearch | sudo gpg --dearmor -o /usr/share/keyrings/elasticsearch-keyring.gpg |
With prerequisite met, you can simply run apt install.
1 | sudo apt install elasticsearch |
Notice that, upon installation, Elasticsearch will output the so-called “Security autoconfiguration information”, which contains an auto-generated superuser.
1 | The generated password for the elastic built-in superuser is : 3*******************O |
Make sure you find this and remember the password. Later in Kibana, you should use this as login.
1.2 Configuring
After installation, there’s few thing we might need to configure, rather than using the default value.
Open /etc/elasticsearch/elasticsearch.yml, and you may need root privilege.
First, you can manually set your cluster’s name.
1 | cluster.name: Beyond-Master |
Then, is the network host and port. By default Elasticsearch can only be accessed by localhost, set it to 0.0.0.0 to allow any. You can also change the default port for Elasticsearch.
1 | network.host: 0.0.0.0 |
Exposing Elasticsearch on the Internet can be dangerous! You can set it to the private network IP address instead, so we can later use Kibana to access it.
If you are not ready to use SSL, go to the last section in YAML, and set all xpack properties from true to false. However, minimal security is strongly recommended. Otherwise, everyone can access you Elasticsearch API, which is very dangerous. To make it clear, you should set xpack.security.enabled and xpack.security.transport.ssl.enabled to true, and leave everything else as they were.
1 | # Enable security features |
1.3 Change Default Password
Now, we have to provide basic authentication (username and password) when we connect. The default password is what you get in Installation, which may be hard to remember, so we’re going to change it.
Go to /usr/share/elasticsearch/, where you can find a bunch of tools coming along with Elasticsearch. Add -i to to this interactively.
1 | ./elasticsearch-reset-password -i -u elastic |
If you disabled password by setting all xpack properties false, then reset password will be unavailable, and you’ll get an exit code 75.
If you change authentication mode of Elasticsearch, you should restart both Elasticsearch and Kibana.
1.4 Run Elasticsearch Service
You may already noticed that Elasticsearch provides you the command to run it after installation. Here is it, you can optionally configure it to start automatically.
1 | # make Elasticsearch start automatically |
Since you start Elasticsearch as a service, you don’t need to run it in tmux.
Now, you can check the connectivity of Elasticsearch.
1 | curl -v elastic http://localhost:9200 |
If you set network.host to private IP, you can run the command on other server in your private network.
One more thing, if you use ufw, please ensure that port 9200 is allowed by the following command.
1 | sudo ufw allow 9200/tcp |
Now, you should have your Elasticsearch operational. 😆
1.5 Service Account
Later, when we use Kibana to connect Elasticsearch, it is recommended to use a service account. Here, we are going to create an elastic/kibana service account.
For more information on service account, see Service accounts.
Go to /usr/shared/elasticsearch/bin directory again. Here, we use elasticsearch-service-tokens to create a new elastic/kibana token called kibana-token. And it will generate a long token for you.
1 | ./elasticsearch-service-tokens create elastic/kibana kibana-token |
Copy and save it for later use. However, it is stored plain text in the file called service-token in /etc/elasticsearch/.
There is no need to restart Elasticsearch here.
2. Setup Kibana
Kibana is used to provide a visualized command panel for Elasticsearch.
2.1 Installation
Kibana’s installation is almost the same as Elasticsearch, just differs in the last word.
1 | sudo apt install kibana |
2.2 Configuring
Well, you know, elastic product, so their file structures are quite similar. Open /etc/kibana/kibana.yml, and you may need root privilege.
First, you can set the port to whatever you like.
1 | server.port: 5601 |
Next, which is important, the server host. Set it to 0.0.0.0 if you want to connect it with any source.
1 | server.host: 0.0.0.0 |
It is also recommended to set the publicBaseUrl. You can leave it commented, though.
1 | server.publicBaseUrl: "http://**.**.**.**:5601" |
Then, you have to tell Kibana where Elasticsearch is. Add the IP and port of your Elasticsearch to hosts.
1 | elasticsearch.hosts: ["http://192.168.0.200:9200"] |
And if you do not use SSL, go below and set this to none.
1 | elasticsearch.ssl.verificationMode: none |
Ok, you are almost there.
2.3 Service Account Token
For security reason, you shouldn’t directly use the superuser to authenticate Kibana. Instead, a service account is recommended. So here, we’re going to use the service account token we generated in 1.4. Still, in /etc/kibana/kibana.yml, add this token.
1 | elasticsearch.serviceAccountToken: "AAE**************************************************Fpn" |
However, it may not be a good idea to store service account token in plain text. So we can go to /usr/share/kibana/bin to create a key store. Again, we can find many command-line tools here.
Use kibana-keystore command to add a key, and it will prompt you to enter the value.
1 | ./kibana-keystore add elasticsearch.serviceAccountToken |
After this, you can check it with kibana-keystore list to see whether it is added or not.
1 | ./kibana-keystore list |
Well, in /etc/kibana/, there is already a file called kibana.keystore. If not, use ./kibana-keystore create to create one.
2.4 Run Kibana Service
Well, the same as Elasticsearch service, we add it to system service.
1 | # make Kibana start automatically |
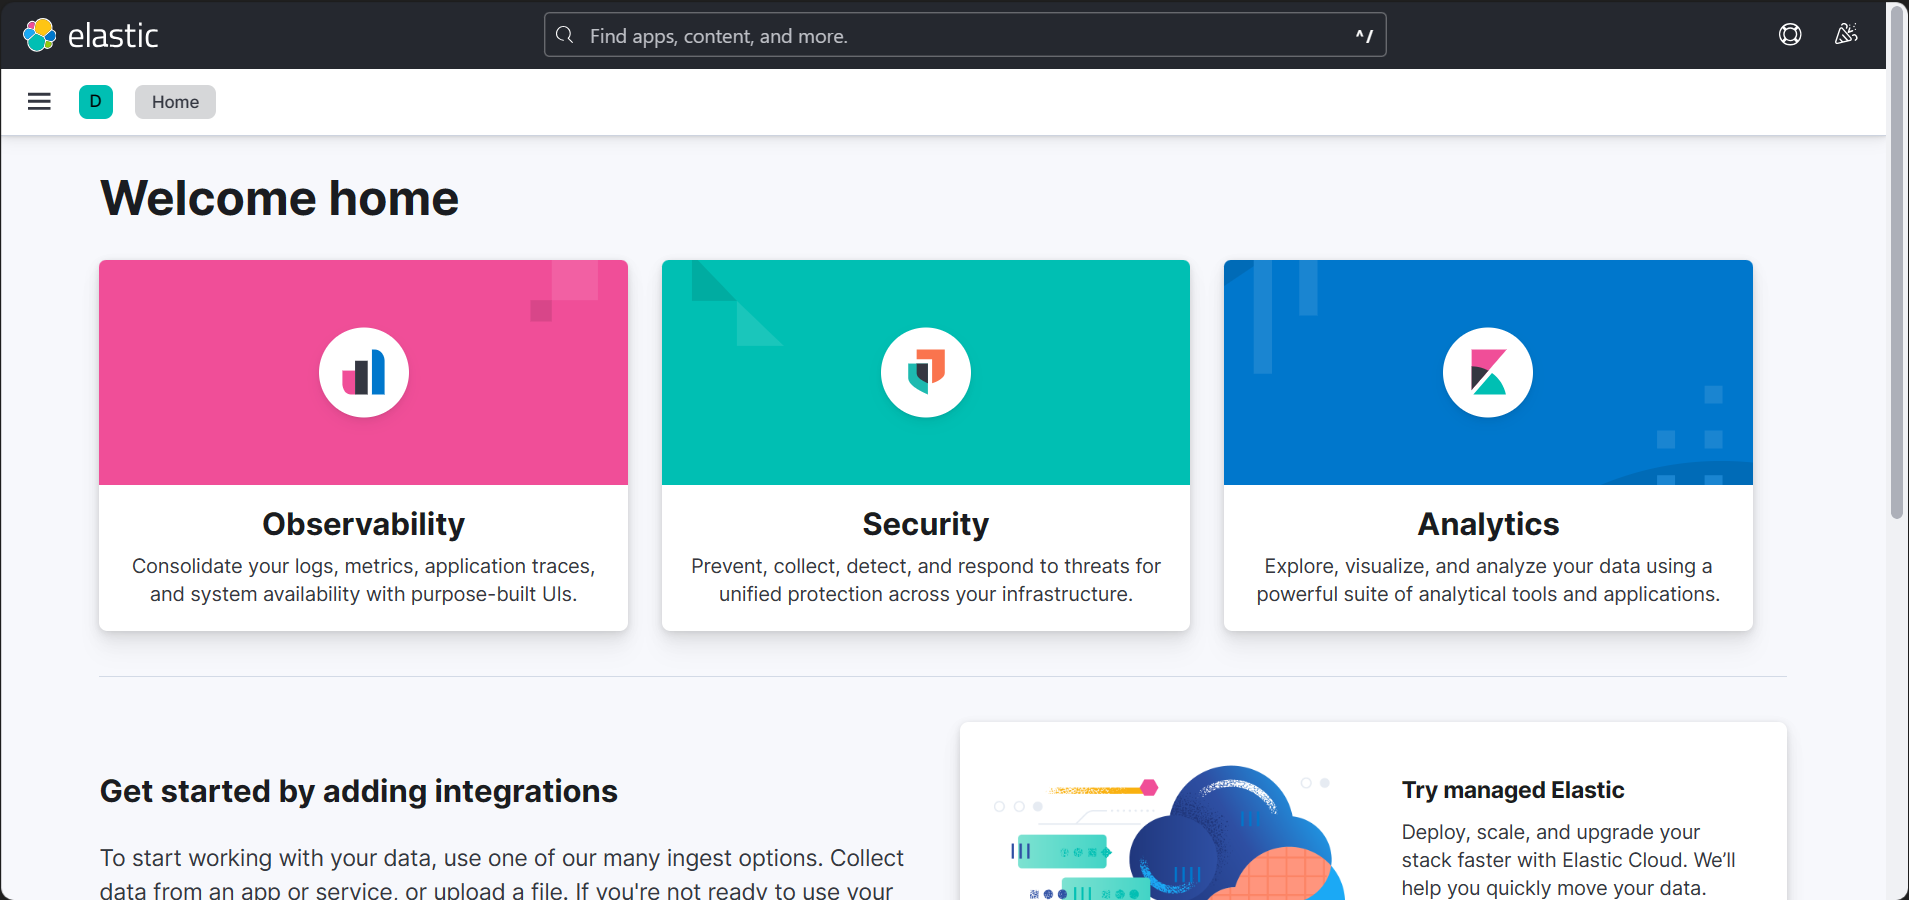
Open the URL in your browser, and you’ll see this. 😆 Of course, you should login first if you enabled authentication.
3. Searching in Kibana
Have to say that… Kibana does much more than visualizing Elasticsearch. It would be a little bit difficult to find where to do this.
In this section, I’m going to show you how to perform basic query in Kibana. I’ll dive deeper in this later when we import our data from MySQL to Elasticsearch.
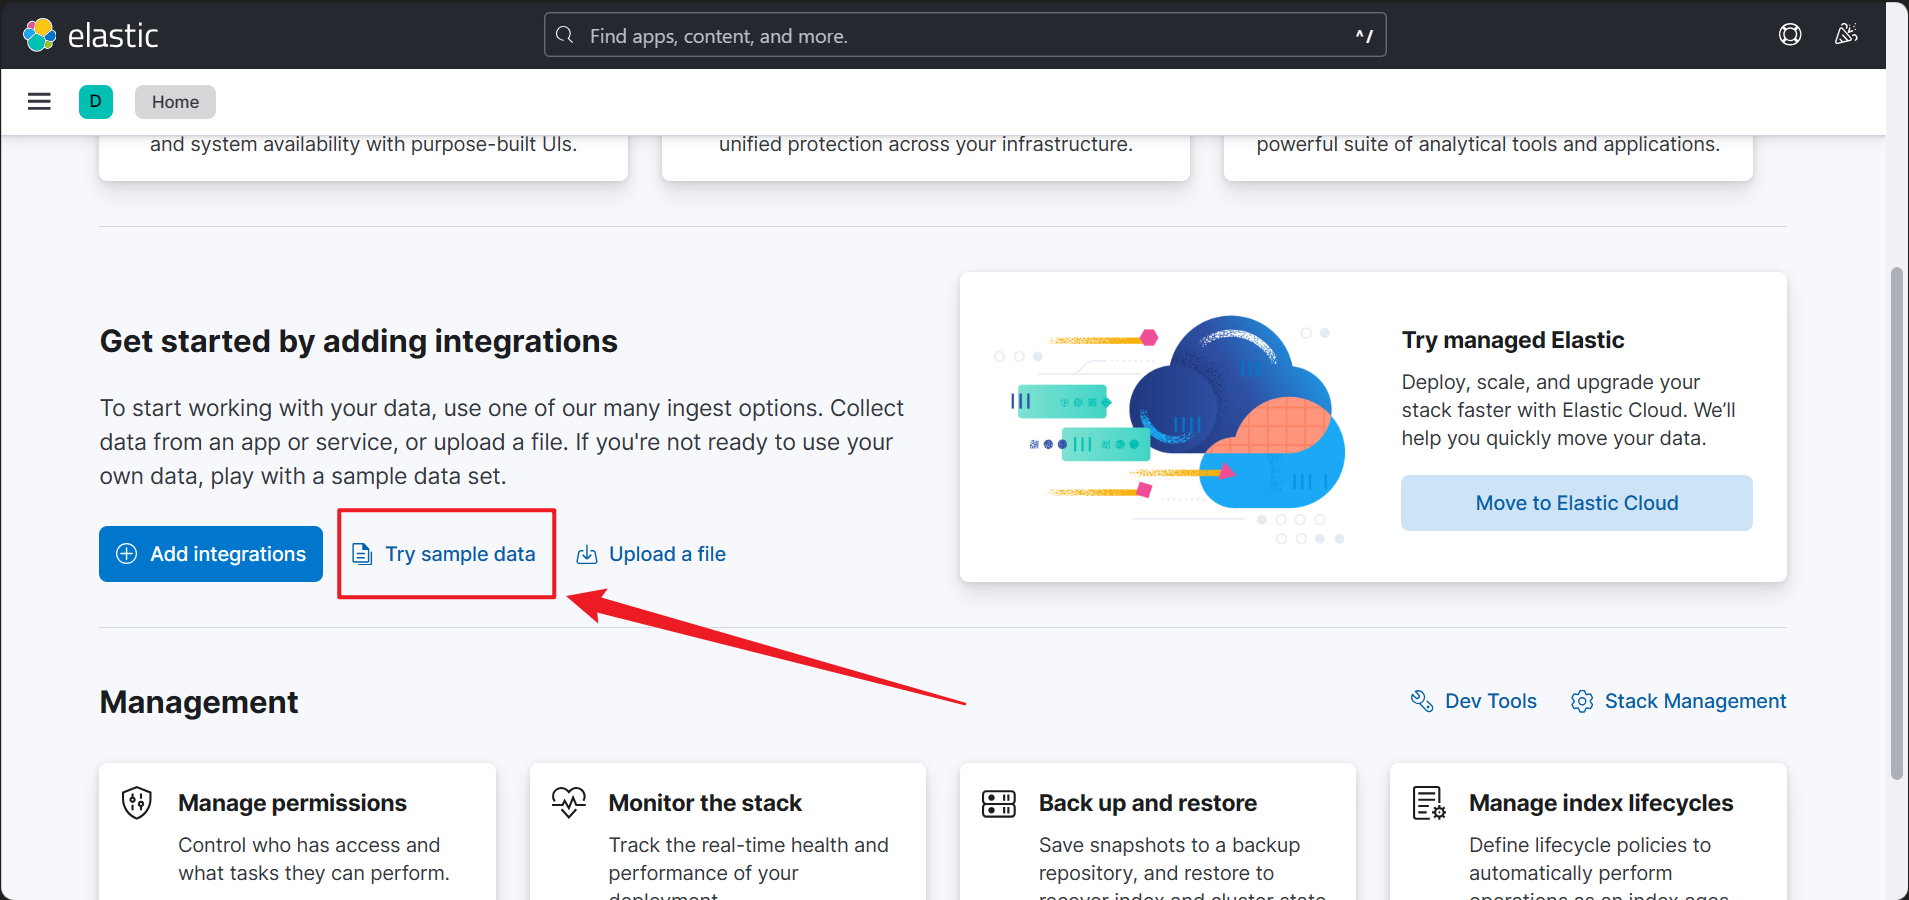
3.1 Add Sample Data
In /app/home#/, you can find the option to add sample data to your Elasticsearch. Choose whatever you like.
3.2 Create Data View
This is hard to find. 🥴 Go to “Management | Stack Management” first.
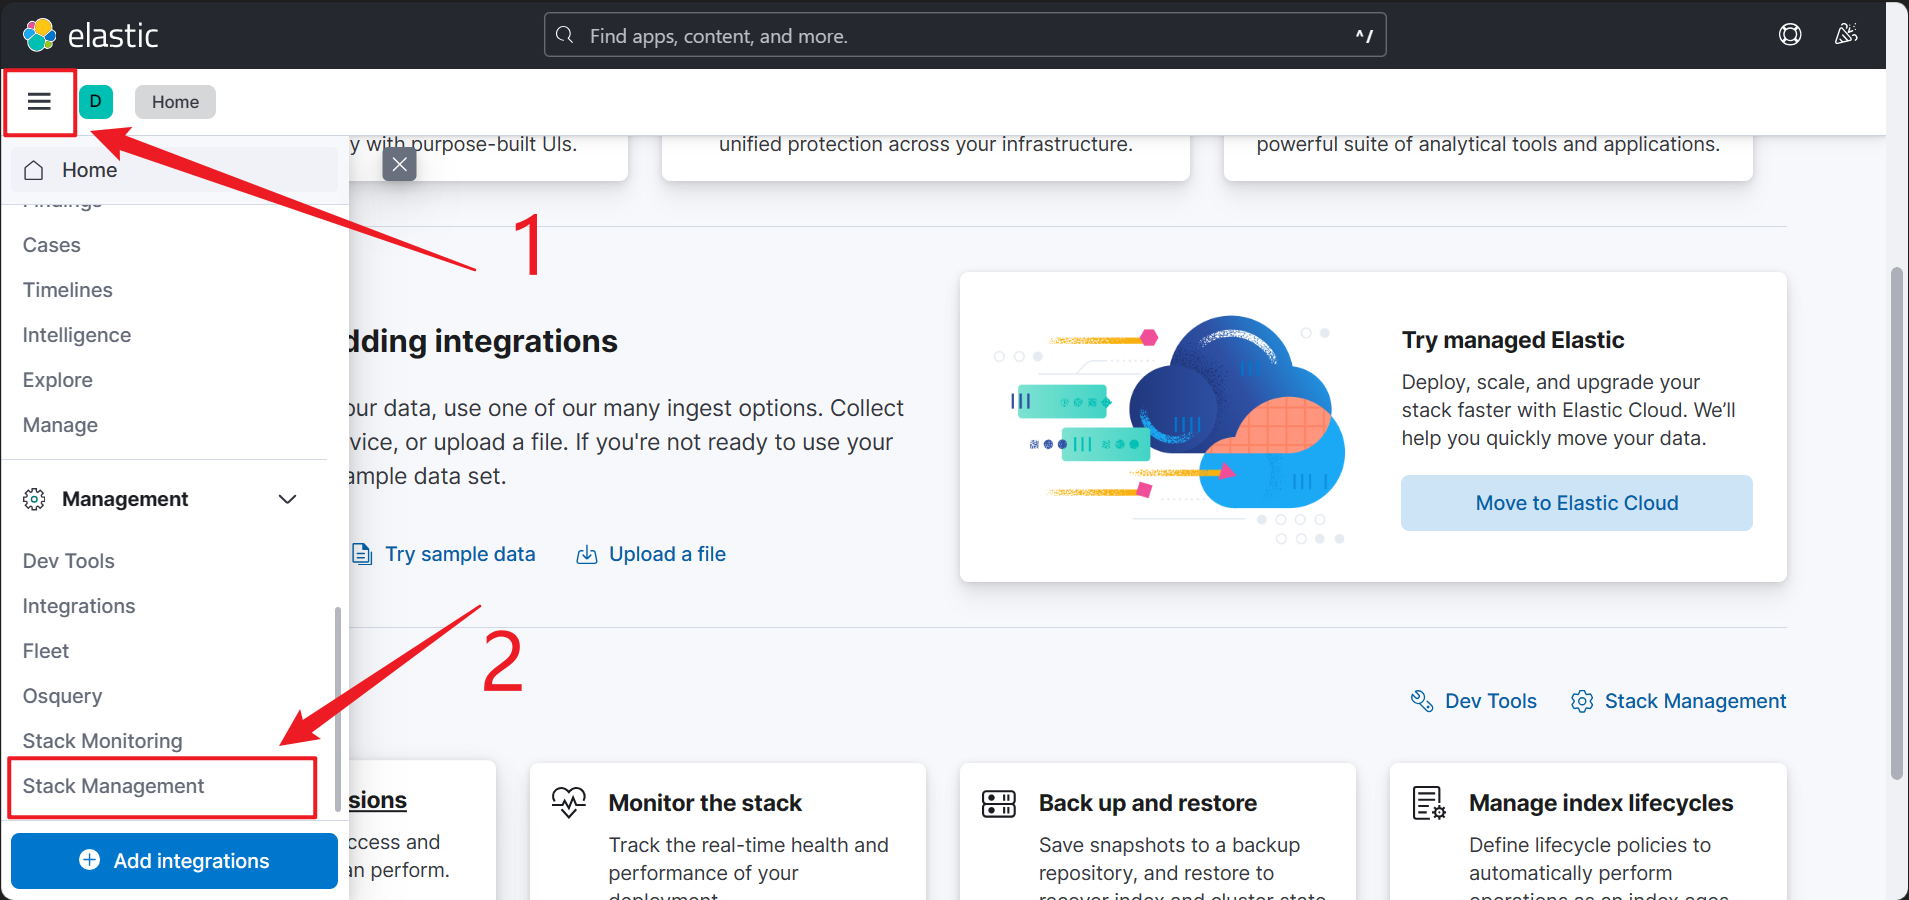
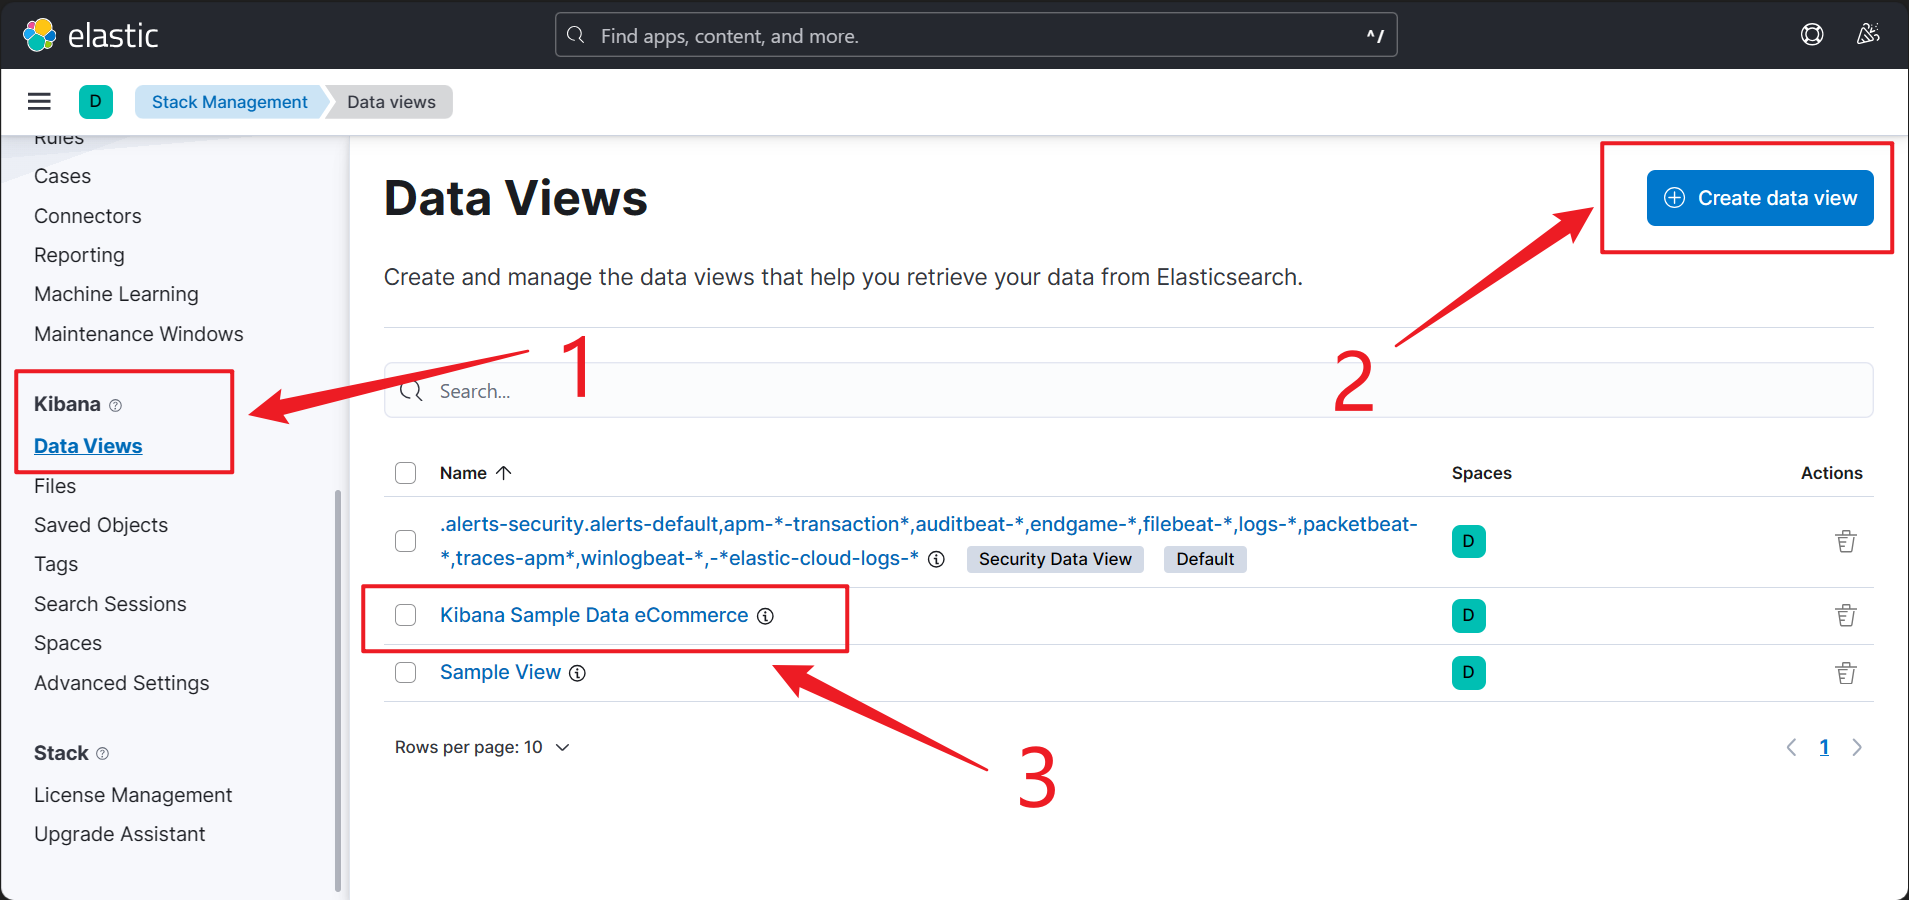
Then, in stack management, go to “Data View”, and click “Create data view”, and select the sample data you’ve just added. After that, you’ll see it in your data views dashboard like 3 below.
3.3 Run Queries
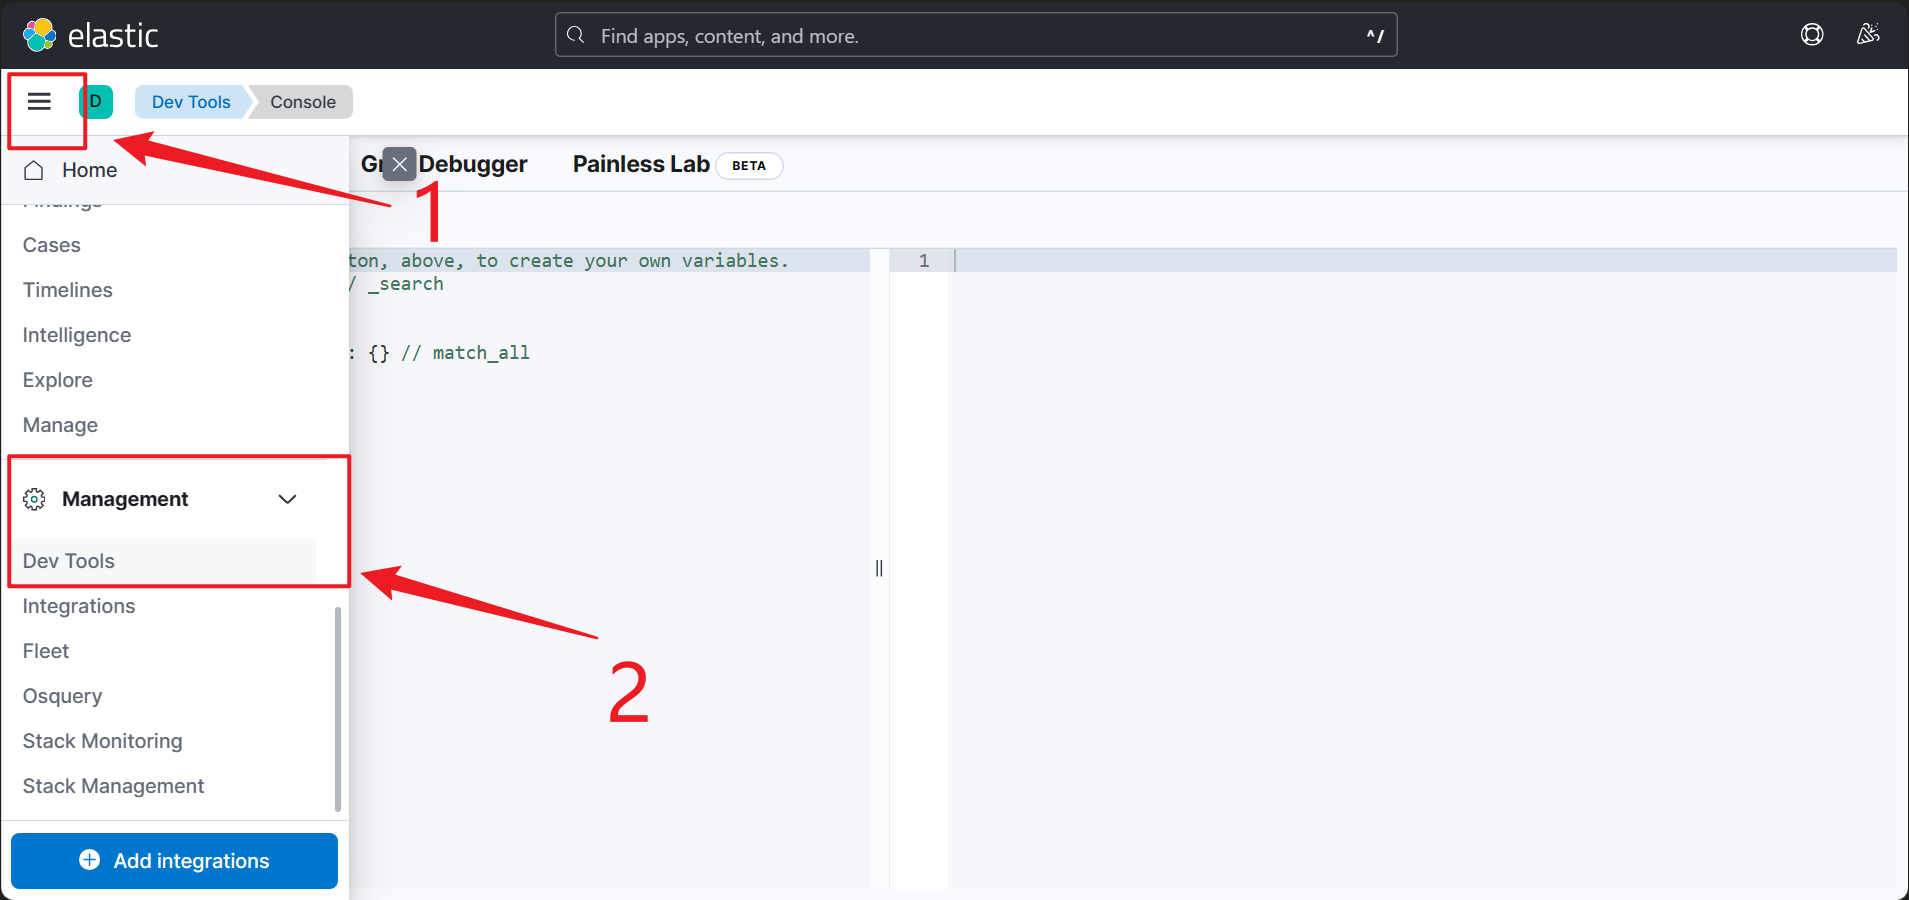
This is even harder to find. 🫠 Go to “Management | Dev Tools”, and you’ll see the console.
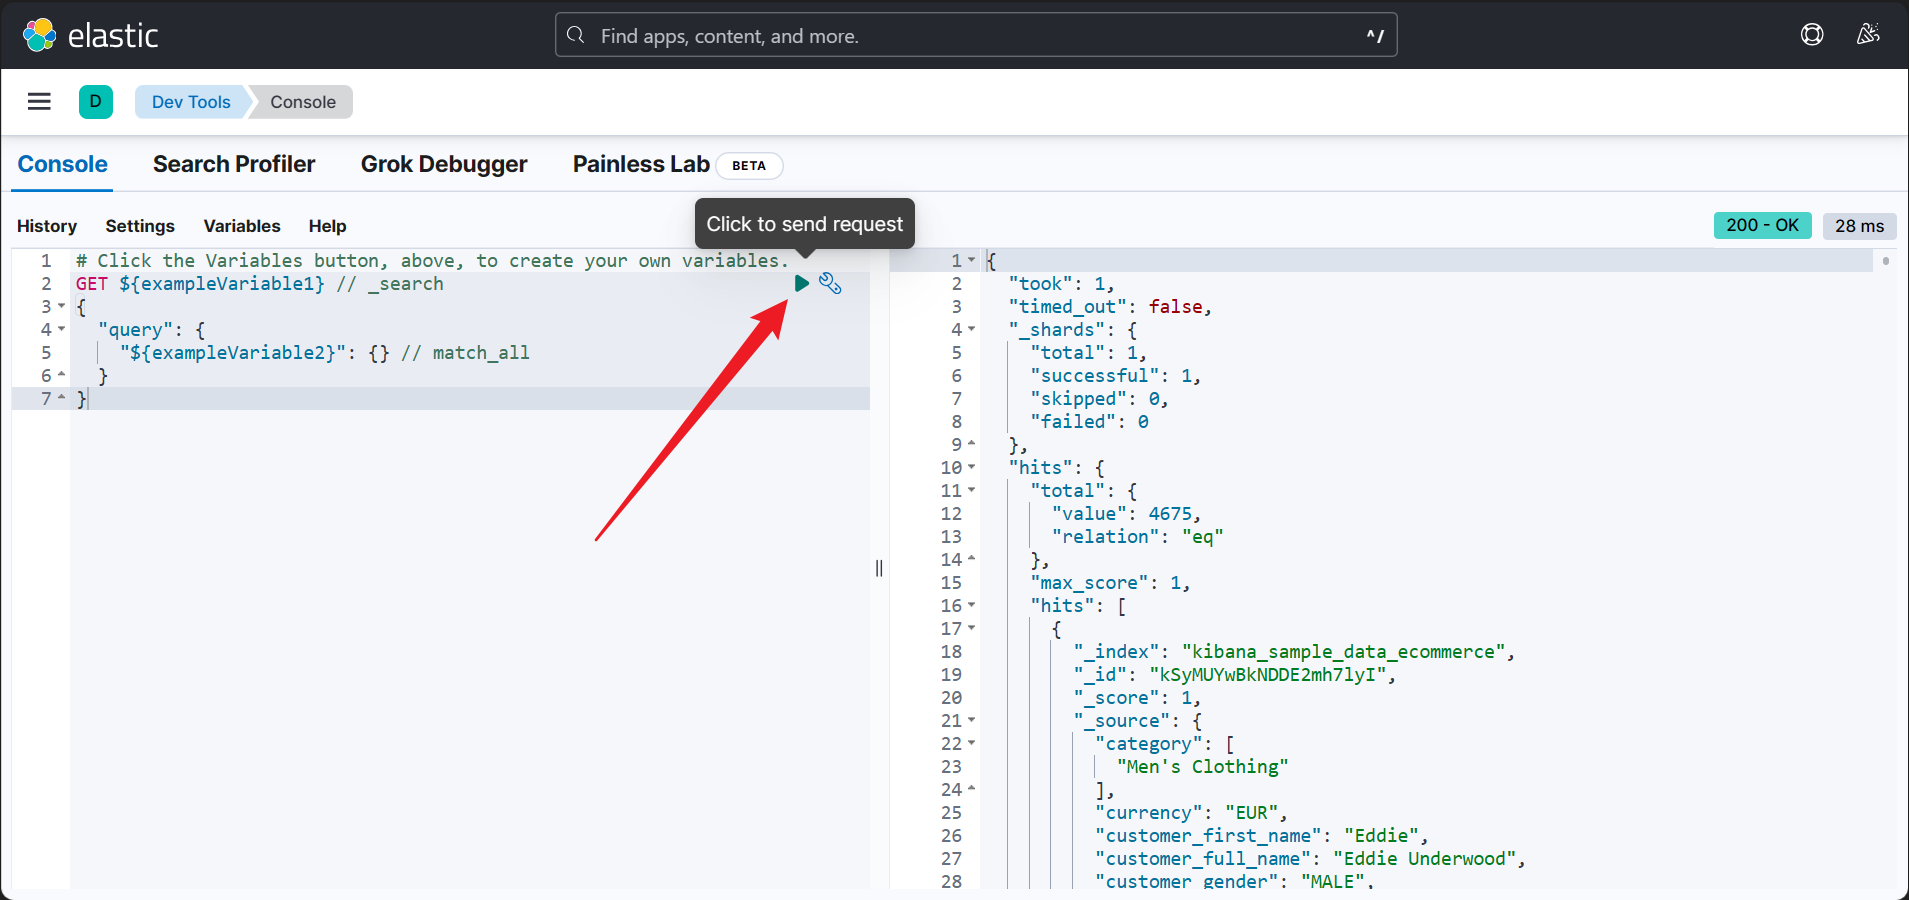
Click to the button to send request to Elasticsearch instance, and if everything goes well, you should be able to see the results in the right panel.
Epilogue
Tada! 🥳 Congratulations, you’ve completed setup for Elasticsearch and Kibana. Although we ignored SSL configuration, it is quite enough for small scale projects.
Thanks for Install Elasticsearch + Kibana 8.x with TLS/SSL again! 🫡
 WeChat


